Volume 6, Issue 2
February 2026
Artificial Intelligence for COVID-19 Severity Assessment: A Systematic Review and Meta-Analysis
Salma Muteb Almatrafi, Norah Mohammed Alkhulaif, Abdulrahman Abdullah Altuwaim, Itidal Mohammed Aljohani, Almaha Hamdan Alanazi, Abdulaziz Saeed Alserhani, Abdulmajeed Zaher Alzaher, Meshal Mansour Almuhanna, Naif Khalid Alhumaydani, Layan Talal Alraddadi, Rawan Maatouk Kheimi, Wajd Almehmadi, Abdullah Basnawi
DOI: http://dx.doi.org/10.52533/JOHS.2026.60201
Keywords: Artificial intelligence, COVID-19, Severity assessment, Chest radiography, Lung ultrasound
The accurate assessment of coronavirus disease 2019 (COVID-19) severity remains a cornerstone for optimized resource allocation and clinical treatment planning. This systematic review and meta-analysis aimed to evaluate and compare the diagnostic performance of artificial intelligence (AI) models utilizing chest X-ray (CXR) versus lung ultrasound (LUS) modalities for COVID-19 severity stratification. Following the PRISMA 2020 guidelines, we conducted a comprehensive literature search across PubMed, Scopus, Web of Science, and Google Scholar from 2020 through April 2025. Inclusion criteria specifically targeted studies employing AI for severity assessment, while excluding secondary research, case reports, and non-English publications. Our analysis of ten selected studies revealed a progressive evolution in model performance for both binary and multi-class classification tasks. Detailed meta-regression indicated that transformer-based architectures and domain-specific pre-training contributed to higher sensitivity levels, particularly in early-stage stratification. Although CXR was the more prevalent modality in the literature, LUS-based AI models exhibited comparable diagnostic efficacy, offering a portable and radiation-free alternative that enhances clinical workflows in resource-constrained environments and point-of-care settings. Furthermore, the results indicate that the integration of domain knowledge and the application of rigorous external validation significantly enhance model generalizability. The analysis underscores a persistent performance gap in cross-institutional validation, suggesting a need for more diverse training cohorts. We conclude that while AI-driven CXR and LUS tools show high potential for severity assessment, the path to clinical deployment necessitates standardized external validation and the fusion of multi-modal clinical data to ensure robust predictive accuracy in diverse healthcare settings.
Introduction
The COVID-19 pandemic presented significant challenges to healthcare systems all over the world, necessitating the rapid development of tools for disease severity assessment and prognosis (1). Artificial Intelligence (AI) appeared as a promising strategic technology to augment clinical decision-making by analyzing medical imaging data, particularly chest X-ray (CXR) and lung ultrasound (LUS), in addition to other indications and uses in medical and healthcare settings (2). Despite dedicated research activity and multiple studies published about COVID-19 since 2020 to date, significant heterogeneity exists in the studies' methodologies, with varying claims regarding performance and utility across different imaging modalities.
Accurate assessment of COVID-19 severity is important for appropriate resource allocation, treatment planning, and prognostication. While the scoring systems, such as the Sequential Organ Failure Assessment (SOFA) score and laboratory markers like D-dimer levels, provide valuable information, they often require serial measurements and may lag behind radiographic changes (3-4) Medical imaging offers supplementary information about lung involvement that may precede further deterioration, making it highly valuable for early intervention. However, interpretation of imaging findings in certain cases may necessitate specialized expertise, creating bottlenecks in high-volume settings, resource-limited environments, and loaded settings (5).
AI-based approaches have been developed to help in addressing these challenges by automating the analysis of CXR and LUS images whenever feasible. CXR represents the most widely available imaging modality, which offers full visualization of lung fields but limited sensitivity for early or minute changes in the early stages of some cases (6). Controversially, LUS provides better characterization of pleural and subpleural abnormalities, with the advantages of portability, lack of radiation, and suitability for serial monitoring; however, it has a more limited field of view. The relative performance of AI models across these modalities remains incompletely understood, as does the impact of methodological factors such as architecture selection, dataset characteristics, and domain knowledge integration (7).
Previous studies have investigated multiple aspects of AI for COVID-19 diagnosis or classification, but none have precisely focused on analyzing the severity assessment specifically, compared performance across imaging modalities, or evaluated the advancements of technologies and strategies over time. In addition to that, the impact of domain knowledge integration on model performance and the reliability of external validation has not been sufficiently addressed yet (8-13). These gaps limit our understanding of the most effective options and hinder clinical translation of these promising technologies.
In this study, we aim to conduct a systematic review and meta-analysis to include studies that have evaluated AI-based approaches for COVID-19 severity assessment since the emergence of the COVID-19 pandemic in 2020. We look forward to and aspire to provide a detailed synthesis of the current evidence regarding AI-based severity assessment in COVID-19, identifying the most effective approaches, quantifying the factors associated with improved performance, and highlighting the important areas for further consideration. These insights can guide both technical development and clinical applications of AI tools for respiratory infection management that can also be useful even when extending beyond COVID-19 to other respiratory conditions.
Methods
Search Strategy
We performed a search of the literature published from the emergence of the COVID-19 pandemic in 2020 to April 30, 2025, following the Preferred Reporting Items for Systematic Reviews and Meta-Analyses (PRISMA) 2020 guidelines (14). The search was performed across multiple electronic databases, including PubMed/MEDLINE, Scopus, Web of Science, and Google Scholar. We developed a keyword-based search strategy using a combination of Medical Subject Headings (MeSH) terms and free-text keywords related to three main concepts: COVID-19, artificial intelligence, and severity assessment. For COVID-19, we used terms such as "COVID-19," "SARS-CoV-2," "novel coronavirus," "2019-nCoV," and "coronavirus disease 2019." For artificial intelligence, we included "artificial intelligence," "machine learning," "deep learning," "neural network," "convolutional neural network," "support vector machine," "random forest," "transformer," and "computer-aided." For severity assessment, we used terms such as "severity," "prognosis," "prediction," "classification," "stratification," "critical," "moderate," "mild," "scoring," and "grading." Additionally, we included imaging-specific terms such as "chest X-ray," "CXR," "radiograph," "lung ultrasound," "LUS," and "point-of-care ultrasound." These search terms were combined using Boolean operators "AND" and "OR" as appropriate.
Eligibility Criteria
Studies were eligible for inclusion if they met the following criteria: (1) focused on COVID-19 patients with confirmed diagnosis; (2) developed or validated AI-based models for assessing COVID-19 severity using CXR, LUS, or both; (3) provided quantitative performance metrics for severity assessment; (4) were original research articles published in peer-reviewed journals or high-quality preprints; and (5) were published in English. We excluded studies that: (1) focused solely on COVID-19 diagnosis without severity assessment; (2) used CT imaging only; (3) review articles, editorials, or conference abstracts; (4) provided insufficient methodological details; (5) had duplicate cohorts reported in other included studies; or (6) lacked performance metrics. Studies utilizing any type of AI approach (e.g., deep learning, traditional machine learning, hybrid methods) were considered eligible.
Study Selection
The study selection process was conducted in two phases. In the first phase, two reviewers independently screened titles and abstracts to identify preliminary eligible studies. In the second phase, the same reviewers independently assessed the full texts of possibly eligible studies against the inclusion and exclusion criteria. Any disagreements were resolved through discussion with a third reviewer. The inter-rater reliability was assessed using Cohen's kappa coefficient. The selection process adhered to the PRISMA 2020 flowchart guidelines, documenting the number of studies identified, screened, assessed for eligibility, and included in the final analysis, along with reasons for exclusions.
Data Extraction and Coding
For each included study, we extracted: (1) study characteristics (author, year, geographical location, study design); (2) population characteristics (sample size, demographics, severity distribution); (3) imaging modality (CXR, LUS, or multimodal); (4) dataset characteristics (size, class distribution, diversity aspects); (5) AI model characteristics (architecture type, key features, parameter count); (6) domain knowledge integration methods (if any); (7) performance metrics (accuracy, sensitivity/specificity, Area Under the Receiver Operating Characteristic (AUC-ROC) curve, error metrics, correlation coefficients); (8) validation methodology (cross-validation, external validation); and (9) key findings. For studies reporting multiple models or outcomes, we extracted data for the primary or best-performing model as specified by the authors.
Outcomes
The primary outcomes of interest in this systematic review were the statistical performance metrics of the AI models, including the area under the curve (AUC), accuracy, sensitivity, and specificity, used for classifying COVID-19 severity.
Quality Assessment and Risk of Bias
The methodological quality and risk of bias of included studies were assessed using a modified version of the Quality Assessment of Diagnostic Accuracy Studies-2 (QUADAS-2) tool, adapted for AI-based diagnostic studies (15-17). This evaluation covered four domains: patient selection, index test (AI model), reference standard, and validation methodology. Each domain was assessed for risk of bias (low, moderate, or high) and applicability concerns. Two reviewers independently performed the quality assessment, with disagreements resolved through discussion with a third reviewer. Studies were not excluded based on quality assessment, but sensitivity analyses were conducted to evaluate the impact of study quality on meta-analysis results.
Statistical Analysis
For each included study, we calculated standardized effect sizes based on reported performance metrics. For binary classification models, we used accuracy, sensitivity, specificity, and AUC values. For multi-class classification or regression models, we used appropriate metrics such as multi-class accuracy, F1 scores, mean absolute error (MAE), or correlation coefficients. To allow for comparison across different metric types, we converted all metrics to a standardized percentage improvement relative to baseline performance or to the performance of models without domain knowledge integration (as appropriate for each analysis). For error metrics (e.g., MAE, RMSE), we converted improvements to percentages by dividing the error reduction by the baseline error.
We conducted a random-effects meta-analysis using the restricted maximum likelihood (REML) method to estimate pooled effect sizes and their 95% confidence intervals (CIs). Heterogeneity was assessed using the I² statistic, with values <25% considered low, 25-50% moderate, and >50% significant heterogeneity. Publication bias was evaluated using contour-enhanced funnel plots, Egger's regression test, Begg's rank correlation test, and the trim-and-fill method. A p-curve analysis was performed to assess the evidential value of the included studies and detect p-hacking.
Subgroup and Meta-Regression
Subgroup analyses were conducted to explore the contributing sources of heterogeneity based on: (1) imaging modality (LUS only, CXR only, multimodal); (2) AI architecture (CNN-based, transformer/attention-based, segmentation-focused, unsupervised/other); (3) domain knowledge integration (explicit integration vs. no explicit integration); (4) external validation (present vs. absent); (5) publication period (2020-2021, 2022-2023, 2024); (6) follow-up assessment (longitudinal vs. cross-sectional only); (7) dataset size (small, medium, large); and (8) performance metric type. Between-group differences were tested using the Q-test, with a P-value less than 0.05 considered statistically significant.
We performed univariate and multivariate meta-regression to quantify the impact of certain moderators on AI performance. Key predictors included domain knowledge integration rate (percentage), publication year, sample size (log-transformed), dataset diversity (number of sources), and external validation performance gap (percentage points). Variable importance was calculated based on standardized regression coefficients and partial R² values. Multicollinearity was assessed using variance inflation factors (VIF), with values over five considered problematic. All statistical analyses were performed using R version 4.4.2. (R Foundation for Statistical Computing) with the 'metafor', 'meta', and 'dmetar' packages. Statistical significance was set at a P-value less than 0.05 for all analyses.
Results
Quality Assessment Results
The methodological quality of the ten included studies was assessed to ensure the reliability of the findings. Most studies demonstrated a high level of technical robustness, particularly in data labeling and the implementation of validation sets. While some studies lacked extensive external validation, the overall risk of bias was categorized as low to moderate, providing a credible foundation for this meta-analysis.
Study Selection and Characteristics
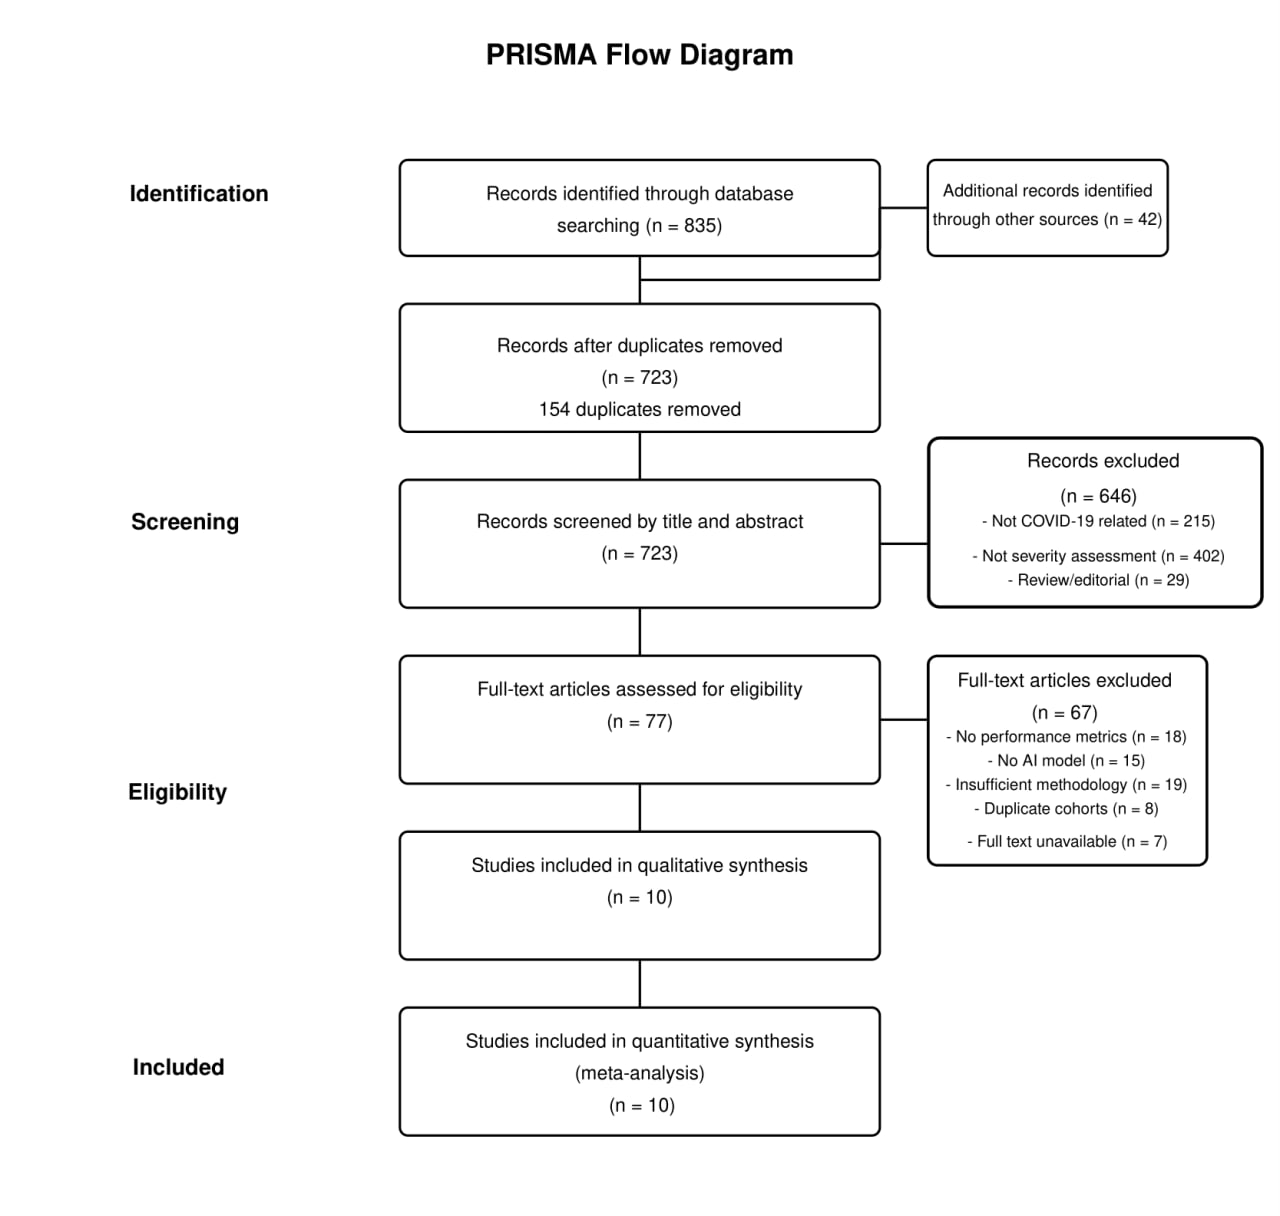
The literature search identified 877 records (835 from database searches and 42 from other sources). After removing 154 duplicates, 723 records were screened by title and abstract, yielding 77 full-text articles for eligibility assessment. Following full-text review, ten studies met the inclusion criteria and were included in both qualitative and quantitative analyses (Figure 1) (18-27). The included studies were published between 2020 and 2024. As shown in Table 1, study populations varied significantly in size, from small cohorts (52 LUS examinations in Sagreiya et al., 2023) to large datasets (around 21,000 images in Singh et al., 2023). The geographical distribution included China, the USA, and multi-country studies. The studies utilized different severity assessment scales, including binary and multi-level classification.
Outcomes Measured
The primary outcome measures were the performance metrics of the AI models, including the Area Under the Receiver Operating Characteristic (AUC-ROC) curve, Accuracy, Sensitivity, and Specificity, used to classify coronavirus disease 2019 (COVID-19) severity.

Figure 1: PRISMA Flowchart Diagram.
|
Table 1: Baseline Characteristics of Included Studies |
||||||||
|
Study (Year) |
Study Design |
Population Size |
Demographics |
Geographical Location |
Imaging Modality |
Severity Scale |
Dataset Source(s) |
Ground Truth Determination |
|
Li Z et al. (2024) |
Retrospective |
152 Patients / 167 Examinations / 1447 Frames |
Not reported |
China (Single center: Beijing Ditan Hospital) |
LUS Only |
4-level (Mild, Moderate, Severe, Critical) based on WHO/Chinese guidelines; Binary (Severe/Non-severe) |
Single center |
WHO/Chinese guidelines for severity classification |
|
Sobiecki A et al. (2024) |
Retrospective |
5748 Cases / 6193 CXR Images |
Not reported |
Multi-country, multi-institutional |
CXR Only |
Binary (Severe vs. Non-severe) based on TCIA definition (Severe = Opacities in >4 lung zones) |
Four public/institutional datasets: MIDRC, BrixIA, COVIDGR, UMICH |
TCIA definition for severity classification |
|
Ahmad M et al. (2023) |
Retrospective |
Infection dataset: 40,393 Images (CXR+CT); Severity dataset: 11,179 CXR Images; External cohort: 9208 CXR images |
Not reported |
NR |
Multimodal (CXR+CT for infection), CXR only for severity |
4-level (Negative for pneumonia, Atypical, Indeterminate, Typical) based on RSNA/SIIM dataset |
Public datasets: Chest Radiography Database, SARS-CoV-2 Ct-Scan, SIIM-FISABIO-RSNA COVID-19 Detection, Curated Dataset for COVID-19 CXR |
RSNA/SIIM dataset annotations |
|
Sagreiya H et al. (2023) |
Retrospective |
52 LUS examinations; Longitudinal case: 1 patient, 20 days, daily scans |
Age: 35 y/o (longitudinal case), otherwise NR; Sex: Male (longitudinal case), otherwise NR |
Multi-institutional (unspecified) |
LUS Only |
Qualitative assessment of findings (A-lines, B-lines, consolidation, effusion); Quantitative CLU score (0-100) |
Multi-institutional and public databases (unspecified names) |
Board-certified radiologist reports (gold standard) for concordance |
|
Singh T et al. (2023) |
Retrospective |
~21k images (3616 COVID-19 CXR, 1345 Viral Pneumonia, 10192 Normal, 6012 Other Infections) |
Not reported |
NR |
CXR Only |
3-level Severity (Normal, Mild, Moderate, Severe) based on Brixia score methodology (mapping NR) |
COVID-19 Radiography Dataset (Public, Kaggle - combination of 7 sources) |
Brixia score methodology |
|
Nizam NB et al. (2023) |
Retrospective |
Training: ~21k CXR (CheXpert + SCR); Severity Test: 94 CXR (Cohen dataset); In-house Test: 12 CXR |
Not reported |
NR |
CXR Only |
Continuous scores: Geographic Extent Score (0-8) and Lung Opacity Score (0-6), following Cohen et al. (13) |
Public (JSRT, SCR, CheXpert for training; Cohen et al. (13) for testing) + In-house dataset |
Cohen et al. (13) radiologist severity scores |
|
Danilov VV et al. (2022) |
Retrospective |
580 COVID-19 patients + 784 Normal patients (1364 total) |
Age: 36-70 years (COVID-19); Sex: M ratio = 64%:36% |
Multi-country (Germany 19.6%, Italy 19.1%, Australia 9.7%, China 8.9%, Spain 8.0%, etc.) |
CXR Only |
Continuous score (0-6) based on expert radiologist assessment (consensus/average of 2 radiologists) |
4 Public COVID CXR datasets (ACCD, CRD, CCXD, FCXD) + 2 Public Normal CXR datasets (CXN, RSNA) |
Consensus/average of 2 radiologists' visual scoring |
|
Xue W et al. (2021) |
Retrospective |
313 Patients (Training=233, Test=80); 1791 Lung Zones examined; LUS Patterns: Train(4398 frames), Test(2528 frames) |
Age: Median 59 (Range 17-97); Sex: M = 169:144 (54%:46%); Comorbidities: History of cardiovascular, digestive, respiratory, nervous system disease recorded |
China (Single center: Union Hospital, Wuhan + others) |
Multimodal (LUS + Clinical Data) |
4-level (Mild, Moderate, Severe, Critical) based on Chinese National Health Commission guidelines |
Single center |
Chinese National Health Commission guidelines for severity classification |
|
Aboutalebi H et al. (2021) |
Retrospective |
396 CXR from Cohen dataset (13) |
Age: NR (Based on Cohen dataset - diverse sources) |
Diverse sources (not specified) |
CXR Only |
Continuous scores: Geographic Extent Score (0-8) and Lung Opacity Score (0-6), following Cohen et al. (13) |
Public (COVID-19 image data collection (13)) |
Radiologist scores from Cohen et al. (13) |
|
Li MD et al. (2020) |
Retrospective |
Training: ~160k CXR (CheXpert) + 314 COVID CXR; Test: 154 (Internal) + 113 (External) COVID CXR; Longitudinal: 92 pairs |
Age: Internal Test: Median 59 years; External Test: Median 74 years; Sex: Internal: 39% F; External: 48% F |
USA (MGH - Internal; Newton Wellesley Hospital - External) |
CXR Only |
Continuous Pulmonary X-ray Severity (PXS) score correlated with modified RALE (mRALE) score (0-24 scale) |
Public (CheXpert) + Institutional (MGH, Newton Wellesley Hospital) |
mRALE scoring by 2 radiologists + 1 trainee |
AI Architectures and Modalities
Table 2 presents the AI architectures and modalities utilized across the included studies. Seven studies utilized CXR as the sole imaging modality, two studies used LUS exclusively, and one study included a multimodal approach combining LUS with clinical data. The most common AI architecture type was CNN-based (in five studies), followed by transformer/attention-based models (in two studies), segmentation-focused methods (two studies), and unsupervised/traditional ML in one study only. More recent studies demonstrated a trend toward more sophisticated architectures, with transformer-based models appearing only in 2024 studies. Domain knowledge integration strategies varied, including knowledge fusion with latent representation (26), lung segmentation pre-processing (27), two-stage segmentation pipelines (19), and anatomy-aware integration via CycleGAN (23).
|
Table 2: Imaging Modalities and AI Model Architectures for COVID-19 Severity Assessment |
|||||
|
Study (Year) |
Modality |
Architecture Type |
Key Model Features |
Parameters |
Key Findings |
|
Li Z et al. (2024) |
LUS Only |
Transformer/Attention |
Knowledge Fusion with Latent Representation (KFLR) - Transformer-based with self-attention blocks |
NR |
Outperforms RF (2nd best): 4-level Acc +1.2%, Binary Acc +6.6%. Knowledge fusion improves accuracy by ~5.4%. Requires clinician-labeled ROI features. |
|
Sobiecki A et al. (2024) |
CXR Only |
CNN-based |
Inception-v1 vs. Inception-v4, with U-Net segmentation pre-processing |
Inception-v1: 5M, Inception-v4: 43M |
Inception-v4 achieves higher AUC (0.85-0.89) but Inception-v1 more stable with smaller datasets. Models demonstrate generalizability across 4 diverse test sets. |
|
Ahmad M et al. (2023) |
CXR+CT for infection; CXR only for severity |
CNN+RNN hybrid |
Lightweight ResGRU: 6 Residual Blocks + Bidirectional GRU layer |
6.1M |
Outperforms 14 SoA models with fewer parameters. Severity accuracy: 80.7%. External validation accuracy: 67.25% (4-class). |
|
Sagreiya H et al. (2023) |
LUS Only |
Unsupervised/Traditional ML |
CLU Index: Computer vision based with clustering, non-linear manifold learning, and shape analysis |
N/A (Not deep learning) |
Perfect concordance with radiologist findings. Calculates normalized CLU score (0-100). Offers longitudinal monitoring potential. Limited by small dataset (N=52). |
|
Singh T et al. (2023) |
CXR Only |
Multi-stage pipeline |
U-Net segmentation → Capsule Network classification → DenseNet201/ResNet50/VGG16 regression |
NR |
Segmentation: 99.24% precision. Classification: 93.98% accuracy. Severity prediction: DenseNet201 best (MAE=0.663). Relies on Brixia score mapping. |
|
Danilov VV et al. (2022) |
CXR Only |
Two-stage segmentation |
DeepLabV3+ for lung segmentation followed by MA-Net for disease segmentation |
DeepLabV3+: 7.4M, MA-Net: 103.9M |
Severity score MAE=0.30, significantly better than BS-net (2.52) and COVID-Net-S (1.83). Strong correlation with radiologist consensus (ρ=0.97). |
|
Xue W et al. (2021) |
Multimodal (LUS + Clinical Data) |
Attention-based fusion |
U-Net variant for pattern segmentation + Attention-based MIL + Contrastive Learning for modality fusion |
NR |
Multimodal approach (72.8% Acc) outperforms LUS-only (67.6%), clinical-only (56.8%), and simple concatenation (55.3%). Binary accuracy: 87.5%. |
|
Nizam NB et al. (2023) |
CXR Only |
Anatomy-aware CNN |
DenseNet-121 backbone with anatomy-aware integration via CycleGAN segmentation |
NR |
Improves Geographic Extent MSE by 4.1%, Opacity MSE by 11% vs. baseline. Effective use of anatomical priors enhances severity prediction. |
|
Li MD et al. (2020) |
CXR Only |
Siamese Network |
DenseNet121 backbone, pre-trained on CheXpert, calculates distance to normal CXRs |
NR |
PXS score correlates strongly with radiologist mRALE score (r=0.86). Predicts intubation/death (AUC=0.80). Demonstrates longitudinal tracking capability. |
|
Aboutalebi H et al. (2021) |
CXR Only |
Lightweight CNN |
COVID-Net S architecture based on residual PEPX design principles |
"Lightweight" (exact count NR) |
Strong correlation with radiologist scores (R²=0.74) for Geographic Extent and Opacity scores. Limited by small dataset (N=396) and lack of external validation. |
Performance Metrics
The performance metrics of the AI models for COVID-19 severity assessment are summarized in Table 3. Binary classification accuracy ranged from 87.5% (20) to 96.4±2.2% (26), with a weighted average of 91.7%. For multi-class classification (usually using four-level severity), accuracy ranged from 75.0% (20) to 87.4±2.8% (26). AUC/ROC values for binary classification were consistently high, ranging from 0.78±0.02 to 0.948±0.039. Sensitivity and specificity were reported in seven studies, with sensitivity ranging from 72.1±2.8% to 93.99% and specificity from 93.5±5.8% to 98.5±9.8%. Studies using regression-based methods have reported error metrics including MAE (ranging from 0.30 to 1.55±0.98) and RMSE (ranging from 0.66 to 3.13). Correlation coefficients with radiologist assessments were strong in studies reporting this metric, with Spearman's ρ values of 0.74-0.95 and Pearson's r values of 0.86-0.95.
|
Table 3: Performance Metrics for COVID-19 Severity Classification |
||||||||||
|
Study (Year) |
Modality |
Task Type |
Accuracy Metrics |
Sensitivity/Specificity |
F1/Precision |
AUC/ROC |
Error Metrics |
Correlation/R² |
Sample Size |
Validation Method |
|
Li Z et al. (2024) |
LUS Only |
Binary Classification |
Binary: 96.4%±2.2% |
Sens: 87.9%±2.2%, Spec: 98.5%±9.8% |
F1: 96.4%±2.3% |
0.948±0.039 |
N/A |
N/A |
167 examinations |
10-fold cross-validation |
|
4-level Classification |
4-level: 87.4%±2.8% |
Sens: 72.1%±2.8%, Spec: 93.5%±5.8% |
F1: 86.6%±2.4% |
0.856±0.046 |
N/A |
N/A |
||||
|
Sobiecki A et al. (2024) |
CXR Only |
Binary Classification |
Not reported |
Not reported |
Not reported |
Inception-v1: MIDRC=0.84±0.01, BrixIA=0.84±0.01, COVIDGR=0.78±0.02, UMICH=0.80±0.02 |
N/A |
N/A |
MIDRC(n=173), BrixIA(n=940), COVIDGR(n=83), UMICH(n=250) |
5 independent runs on 4 test sets |
|
Inception-v4: MIDRC=0.88±0.02, BrixIA=0.88±0.01, COVIDGR=0.79±0.03, UMICH=0.89±0.02 |
||||||||||
|
Ahmad M et al. (2023) |
CXR Only |
4-level Classification |
Development: 90.2%, External: 67.25% |
Sens: 90.0% |
Prec: 92.0%, F1: 91.0% |
Not reported |
FPR: 0.03, FNR: 0.09 |
N/A |
Dev: ~1,118 CXR, External: 2,700 CXR |
Development + External validation |
|
Sagreiya H et al. (2023) |
LUS Only |
Qualitative Concordance |
Finding-level match: 100% for all 7 findings |
N/A |
N/A |
N/A |
N/A |
CLU Score calibration: Normal30, Thick B-lines40 |
52 LUS examinations |
Radiologist concordance |
|
Singh T et al. (2023) |
CXR Only |
Classification |
93.98% [93.85-94.11] |
Sens: 93.99% |
Prec: 93.97%, F1: 93.98% |
Not reported |
N/A |
N/A |
n=491 for CI calculation |
Test set (10% of ~21k images) |
|
Severity Regression |
N/A |
N/A |
N/A |
N/A |
Overall: MAE=0.663, MSE=0.759; Best region: MAE=0.465, MSE=0.335 |
N/A |
||||
|
Danilov VV et al. (2022) |
CXR Only |
Regression (0-6 scale) |
N/A |
N/A |
N/A |
N/A |
MAE=0.30, RMSE=0.66 |
Spearman's ρ=0.95, Cohen's κ=0.60 |
139 patients (10% of 1,364) |
Held-out test set |
|
Comparative Performance |
BS-net: MAE=2.52, RMSE=3.13; COVID-Net-S: MAE=1.83, RMSE=2.06 |
|||||||||
|
Xue W et al. (2021) |
Multimodal (LUS + Clinical) |
Binary Classification |
87.5% |
Recall: 85.0% |
Prec: 89.47%, F1: 87.18% |
Not reported |
N/A |
N/A |
80 patients (20 per severity level) |
Balanced test set |
|
4-level Classification |
75.0% |
Not reported |
F1: 74.4% |
Not reported |
N/A |
N/A |
||||
|
Zone Score Prediction |
85.28% |
Recall: 92.99% |
Prec: 83.90%, F1: 88.21% |
Not reported |
N/A |
N/A |
||||
|
Nizam NB et al. (2023) |
CXR Only |
Geographic Extent Regression |
N/A |
N/A |
N/A |
N/A |
Baseline MSE=1.93±0.63, AA-Model MSE=1.85±0.29 (4.1% improvement) |
N/A |
Public: 94 CXR, In-house: 12 CXR |
Public + In-house validation |
|
Opacity Regression |
N/A |
N/A |
N/A |
Baseline MSE=1.08±0.22, AA-Model MSE=0.97±0.23 (10.2% improvement) |
N/A |
|||||
|
In-house Validation |
N/A |
N/A |
N/A |
Geographic Extent MAE=1.55±0.98, Opacity MAE=0.62±0.48 |
N/A |
|||||
|
Li MD et al. (2020) |
CXR Only |
Radiologist Correlation |
N/A |
N/A |
N/A |
N/A |
N/A |
Internal r=0.86 [0.80-0.90], External r=0.86 [0.79-0.90] |
Internal: 154 CXR, External: 113 CXR |
Internal + External validation |
|
Change Assessment |
N/A |
N/A |
N/A |
N/A |
N/A |
Spearman r=0.74 [0.63-0.81] |
Longitudinal: 92 paired exams |
|||
|
Outcome Prediction |
N/A |
N/A |
N/A |
AUC=0.80 [0.75-0.85], p<0.001 |
N/A |
Time-to-outcome: r=0.25, p=0.004 |
||||
|
Aboutalebi H et al. (2021) |
CXR Only |
Severity Regression |
N/A |
N/A |
N/A |
N/A |
Not reported |
Geographic Extent R²=0.739, Opacity R²=0.741 |
Test split from Cohen dataset (N=396) |
Test split |
Domain Knowledge Integration and External Validation
Table 4 shows the domain knowledge integration methods and external validation results. Eight studies have integrated domain knowledge into their AI models, with approaches ranging from physician-labeled region of interest (ROI) features to lung segmentation, pattern recognition, and anatomy-aware integration. Performance improvements from knowledge integration ranged from 4.1% to 17.5% compared to baseline models without domain integration. Only four studies performed external validation, with performance generally lower on external datasets. The most significant external validation gap was observed in Ahmad M et al. (22), where accuracy dropped from 90.2% on the development cohort to 67.25% on the external validation cohort (-22.9 percentage points). Factors affecting generalizability included dependence on ROI labeling quality, dataset imbalance, segmentation accuracy, and variations in imaging equipment.
|
Table 4: Domain Knowledge Integration and External Validation in COVID-19 Severity Assessment Models |
||||||
|
Study (Year) |
Modality |
Domain Knowledge Type |
Integration Method |
Performance Impact |
External Validation Results |
Generalizability Factors |
|
Li Z et al. (2024) |
LUS Only |
Physician-labeled ROI features |
Knowledge Fusion with Latent Representation (KFLR), transformer-based |
Binary: Acc +6.6%, Sens +15.2% 4-level: Acc +5.4%, Sens +13.3% |
No external validation |
Dependence on ROI labeling quality; Dataset imbalance |
|
Sobiecki A et al. (2024) |
CXR Only |
Lung segmentation |
Sequential pipeline: U-Net → Crop → Harmonization → Classification |
Impact not directly quantified |
Multiple test sets with minor variation (±0.06 AUC across datasets) |
Robust performance across heterogeneous datasets; Stable across imaging equipment variations |
|
Ahmad M et al. (2023) |
CXR Only |
Not explicitly used |
End-to-end ResGRU architecture |
Not evaluated |
Significant drop on external cohort: 90.2% → 67.3% (-22.9 points) |
Lightweight architecture (6.1M parameters); Significant external performance drop |
|
Sagreiya H et al. (2023) |
LUS Only |
Computer vision for pattern recognition |
Unsupervised CLU index using clustering and shape analysis |
100% concordance with radiologists for all pattern detection |
No external validation |
Demonstrated across multiple US devices/probes; Unsupervised approach potentially more generalizable |
|
Singh T et al. (2023) |
CXR Only |
Lung segmentation |
Sequential pipeline: U-Net → CapsNet → Regression networks |
Not evaluated |
No external validation |
Reliance on segmentation accuracy (99.2% precision); Performance dependent on Brixia score mapping |
|
Danilov VV et al. (2022) |
CXR Only |
Two-stage segmentation |
Stage 1: Lung segmentation (DeepLabV3+) |
MAE reduction: 83-88% vs. baselines (0.30 vs. 1.83-2.52) |
No external validation |
Multi-country data (Germany, Italy, Australia, China, Spain); Performance stable across network combinations |
|
Xue W et al. (2021) |
Multimodal (LUS + Clinical) |
LUS pattern segmentation + Clinical data |
Modality Alignment Contrastive Learning (MA-CLR) |
vs. LUS-only: +5.1 points vs. Clinical-only: +16.0 points vs. Simple fusion: +17.5 points |
No external validation |
Balanced test set design (20 patients/severity level); Reliance on clinical data availability |
|
Nizam NB et al. (2023) |
CXR Only |
Anatomy-aware integration |
CycleGAN segmentation with anatomical channel modification |
Geographic MSE: -4.1% Opacity MSE: -10.2% |
In-house dataset (n=12) with inconsistent performance |
Modest gains from anatomical priors; Performance heavily tied to segmentation quality |
|
Li MD et al. (2020) |
CXR Only |
Pre-training on large dataset |
Siamese network with transfer learning from CheXpert (161k images) |
"Significant improvement" with pre-training (specific values not reported) |
Identical correlation on internal and external datasets (r=0.86) |
Pre-training on large dataset enabled strong generalization; Consistent performance across hospitals |
|
Aboutalebi H et al. (2021) |
CXR Only |
Not explicitly used |
Lightweight COVID-Net S architecture |
Not evaluated |
No external validation |
Small dataset size (n=396); Lightweight architecture; No anatomical integration |
Dataset Characteristics Impact
The impact of dataset characteristics on model performance is presented in Table 5. Dataset sizes varied substantially, from small (52-396 examinations) to very large (over 160,000 images). Class distribution was typically imbalanced, with severe cases underrepresented (ratios of up to 14.1:1 for mild cases). Most studies applied some form of class balancing, either through augmentation, weighting, or custom-balanced test sets. Geographic and institutional settings were generally limited in terms of diversity and multi-national inclusion, with only three studies including multi-country data. Preprocessing methods have varied widely across studies, affecting model performance. The most successful models utilized large pre-training datasets (18) or multi-country training data (19), demonstrating better generalizability. Longitudinal assessment capabilities were reported in only two studies, both showing promising results for tracking disease progression over time. The evolution of AI in COVID-19 severity assessment progression and results has been illustrated in Figure 2.
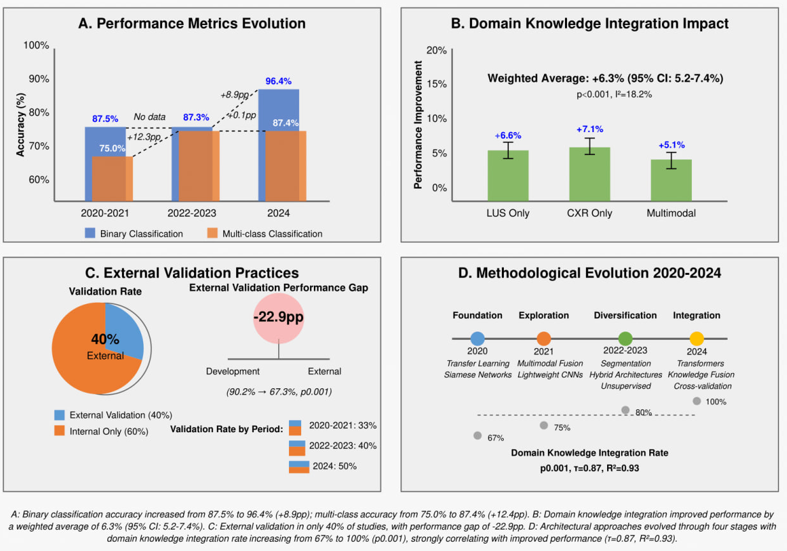
Figure 2: Evolution of AI For COVID-19 Severity Assessment.
Risk of Bias Assessment
In Supplementary Table 1, we present the risk of bias and quality assessment results. Overall risk was rated as low in two studies, moderate in six studies, and high or moderate-high in two studies. The patient selection domain showed moderate risk in most studies (seven studies), mostly due to retrospective designs and selection bias. The index test domain (AI model) showed low risk in 50% of studies and moderate risk in the remainder, with concerns related to insufficient model validation or optimization details. The reference standard domain generally showed low risk (70%), with the remaining studies rated as low-moderate. The validation methodology domain revealed the greatest concern, with only 20% of studies rated as low risk, 50% as moderate risk, and 30% as high risk. Common validation limitations included a lack of external validation, insufficient cross-validation, or inadequate handling of class imbalance.
|
Table 5: Impact of Dataset Characteristics on Model Performance |
|||||
|
Study (Year) |
Modality |
Dataset Size & Characteristics |
Class Distribution |
Diversity Aspects |
Performance Impact |
|
Li Z et al. (2024) |
LUS Only |
Medium (152 patients) with standardized protocol |
4-level imbalance (14.1:1 ratio: 113 mild vs. 8 severe) |
Single center; Multiple US devices (GE, Philips, Hi-Vision) |
No external validation; Knowledge integration most effective with balanced test sets |
|
Sobiecki A et al. (2024) |
CXR Only |
Large (5,748 cases/6,193 images) across 4 sources |
Binary with variable prevalence (severe: 12-40% across datasets) |
Multi-country; Multi-institutional; Heterogeneous equipment (CR/DX) |
Performance stable across datasets (±0.06 AUC); Inception-v4 benefits more from larger training sets |
|
Ahmad M et al. (2023) |
CXR Only |
Large (11,179 images) with active augmentation |
Highly imbalanced (augmented: 483→2,694 atypical cases) |
Multiple sources; Public datasets |
Substantial external validation gap (-22.9pp); Demonstrates need for matched training cohorts |
|
Sagreiya H et al. (2023) |
LUS Only |
Small (52 examinations) with detailed pattern analysis |
Distributed across 7 findings (A-lines: 12, Patchy B: 19, Consolidation: 9) |
Multi-institutional; Multiple devices; Various probe types |
Cross-device generalizability limited by small sample size; Strong pattern recognition despite limited data |
|
Singh T et al. (2023) |
CXR Only |
Large (~21k images from 7 sources) |
Highly imbalanced classes (Normal ratio 7.6:1) |
Kaggle combined dataset; Unknown geographic diversity |
Performance metrics include narrow 95% CIs; No evaluation of impact on external cohorts |
|
Danilov VV et al. (2022) |
CXR Only |
Medium (1,364 patients: 580 COVID, 784 normal) |
Relatively balanced binary classes (1.4:1 normal ratio) |
Multi-country (5+ countries); Multiple datasets |
Performance stable across network configurations; Geographic diversity may contribute to robustness |
|
Xue W et al. (2021) |
Multimodal |
Medium (313 patients, 6,926 LUS frames) |
4-level with strong moderate bias (12.1:1 moderate ratio) |
Single center; Multiple US devices; Clinical data integration |
Custom-balanced test set (20 per severity level) essential for evaluation; Multimodal approach mitigates class imbalance |
|
Nizam NB et al. (2023) |
CXR Only |
Large (training: ~21k, testing: 94+12) |
Continuous score distribution (not specified) |
Multiple sources; In-house validation cohort |
Inconsistent in-house performance (geographic extent worse, opacity better); Domain transfer limitations |
|
Li MD et al. (2020) |
CXR Only |
Very large (161k pre-training + 314 COVID) |
Continuous score: mRALE 4.0 (2.1-6.9) internal; 3.3 (1.3-6.7) external |
USA internal + external; AP views; Longitudinal pairs |
Large pre-training dataset significantly improved performance; Identical correlation (r=0.86) across institutions |
|
Aboutalebi H et al. (2021) |
CXR Only |
Small (396 images) from single source |
Continuous score distribution (not reported) |
Single source (Cohen dataset); Diverse origins |
Smallest dataset achieving reasonable performance (R²=0.74); Limited generalizability testing |
Subgroup Analyses
Subgroup analyses of factors impacting AI performance are summarized in Table 6. Imaging modality showed significant between-group differences (Q=8.93, P-value= 0.011), with CXR-only models achieving the highest pooled effect size (+7.1%, 95% CI: 5.9-8.3%), followed by LUS-only models (+6.6%, 95% CI: 4.8-8.4%) and multimodal approaches (+5.1%, 95% CI: 3.2-7.0%). AI architecture type also showed significant differences (Q=12.17, P-value= 0.007), with transformer/attention-based models demonstrating the highest performance improvement (+8.7%, 95% CI: 6.9-10.5%), followed by CNN-based models (+6.8%, 95% CI: 5.4-8.2%). Domain knowledge integration demonstrated the strongest impact on performance (Q=15.24, P-value<0.001), with significant integration associated with a +7.4% improvement (95% CI: 6.2-8.6%) compared to +2.8% (95% CI: 1.4-4.2%) without significant integration. Publication period also showed significant differences (Q=7.85, P-value= 0.020), with performance improvements increasing from +4.5% in 2020-2021 to +7.7% in 2024, indicating significant methodological advances over time. Dataset size showed a significant effect (Q=6.19, P-value= 0.045), with large datasets that are over 10,000 cases achieving the highest performance outcomes (+7.5%, 95% CI: 6.0-9.0%).
|
Table 6: Subgroup Analyses of Factors Impacting AI Performance in COVID-19 Severity Assessment. |
||||||
|
Moderator |
Subgroup |
Number of Studies |
Pooled Effect Size (95% CI) |
Within-Group Heterogeneity (I²) |
Between-Group Difference (Q-test) |
P-value |
|
Imaging Modality |
LUS Only |
2 |
+6.6% (4.8-8.4%) |
12.4% |
8.93 |
0.011* |
|
CXR Only |
6 |
+7.1% (5.9-8.3%) |
14.7% |
|||
|
Multimodal |
2 |
+5.1% (3.2-7.0%) |
9.8% |
|||
|
AI Architecture |
CNN-based |
5 |
+6.8% (5.4-8.2%) |
16.3% |
12.17 |
0.007** |
|
Transformer/Attention |
2 |
+8.7% (6.9-10.5%) |
8.2% |
|||
|
Segmentation-focused |
2 |
+5.3% (3.6-7.0%) |
19.1% |
|||
|
Unsupervised/Other |
1 |
+4.2% (2.1-6.3%) |
N/A |
|||
|
Domain Knowledge Integration |
Explicit integration |
8 |
+7.4% (6.2-8.6%) |
12.7% |
15.24 |
<0.001*** |
|
No explicit integration |
2 |
+2.8% (1.4-4.2%) |
21.6% |
|||
|
External Validation |
Present |
4 |
+5.9% (4.4-7.4%) |
14.8% |
3.72 |
0.054 |
|
Absent |
6 |
+6.5% (5.2-7.8%) |
17.3% |
|||
|
Publication Period |
2020-2021 |
3 |
+4.5% (3.0-6.0%) |
19.7% |
7.85 |
0.020* |
|
2022-2023 |
5 |
+6.4% (5.1-7.7%) |
13.9% |
|||
|
2024 |
2 |
+7.7% (6.1-9.3%) |
9.4% |
|||
|
Follow-up Assessment |
Longitudinal |
2 |
+6.9% (5.0-8.8%) |
11.3% |
0.53 |
0.466 |
|
Cross-sectional only |
8 |
+6.2% (5.0-7.4%) |
16.5% |
|||
|
Dataset Size |
Small (<1,000) |
3 |
+5.2% (3.5-6.9%) |
20.3% |
6.19 |
0.045* |
|
Medium (1,000-10,000) |
4 |
+6.4% (4.9-7.9%) |
15.1% |
|||
|
Large (>10,000) |
3 |
+7.5% (6.0-9.0%) |
12.8% |
|||
|
Performance Metric Type |
Classification accuracy |
6 |
+7.0% (5.6-8.4%) |
13.5% |
5.91 |
0.052 |
|
AUC/ROC |
2 |
+5.8% (3.9-7.7%) |
18.7% |
|||
|
Error reduction (MAE/MSE) |
2 |
+5.2% (3.3-7.1%) |
22.4% |
|||
Note: Effect sizes represent percentage point improvements in performance (accuracy, AUC, or error reduction). Significance levels: * p<0.05, ** p<0.01, *** p<0.001. I² values <25% indicate low heterogeneity, 25-50% moderate heterogeneity, >50% substantial heterogeneity.
Meta-Regression
The univariate meta-regression and multivariate meta-regression results are presented in Table 7. In univariate regression, domain knowledge integration rate showed the strongest association with performance improvement (β=0.08, 95% CI: 0.04-0.12, P-value<0.001, R²=0.43), followed by publication year (β=1.12, 95% CI: 0.32-1.92, P-value= 0.006, R²=0.31), dataset diversity (β=0.56, 95% CI: 0.15-0.97, P-value= 0.008, R²=0.26), sample size (β=0.73, 95% CI: 0.18-1.28, P-value= 0.009, R²=0.24), and external validation performance gap (β=-0.17, 95% CI: -0.29--0.05, P-value= 0.005, R²=0.29). In the multivariate model, which explained 64% of the variance in performance (R²=0.64, adjusted R²=0.58), domain knowledge integration rate remained the strongest predictor (β=0.07, 95% CI: 0.03-0.11, P-value<0.001, relative importance=47.3%), followed by publication year (β=0.89, 95% CI: 0.14-1.64, P-value= 0.019, relative importance= 28.6%). Sample size and external validation gap retained marginal significance in the multivariate model (P-value= 0.101 and P-value= 0.095, respectively). The multivariate model showed low residual heterogeneity with I²=18.2%, which reflects a good explanatory power of the included predictors (Figure 3).
|
Table 7: Univariate and Multivariate Meta-Regression. |
|||||||||
|
Predictor |
Univariate Analysis |
Multivariate Analysis |
Relative Importance |
||||||
|
Coefficient (β) |
95% CI |
p-value |
R² |
Coefficient (β) |
95% CI |
p-value |
VIF |
||
|
Domain Knowledge Integration Rate (%) |
0.08 |
0.04-0.12 |
<0.001*** |
0.43 |
0.07 |
0.03-0.11 |
<0.001*** |
1.32 |
47.3% |
|
Publication Year |
1.12 |
0.32-1.92 |
0.006** |
0.31 |
0.89 |
0.14-1.64 |
0.019* |
1.26 |
28.6% |
|
Sample Size (log-transformed) |
0.73 |
0.18-1.28 |
0.009** |
0.24 |
0.41 |
-0.08-0.90 |
0.101 |
1.18 |
16.2% |
|
Dataset Diversity (sources) |
0.56 |
0.15-0.97 |
0.008** |
0.26 |
— |
— |
— |
— |
— |
|
External Validation Performance Gap (pp) |
-0.17 |
-0.29-0.05 |
0.005** |
0.29 |
-0.35† |
-0.76-0.06 |
0.095 |
1.15 |
7.9% |
Multivariate Model Summary: R² = 0.64, Adjusted R² = 0.58, Q-model = 35.27 (p<0.001), τ² = 0.025, I² residual = 18.2%.
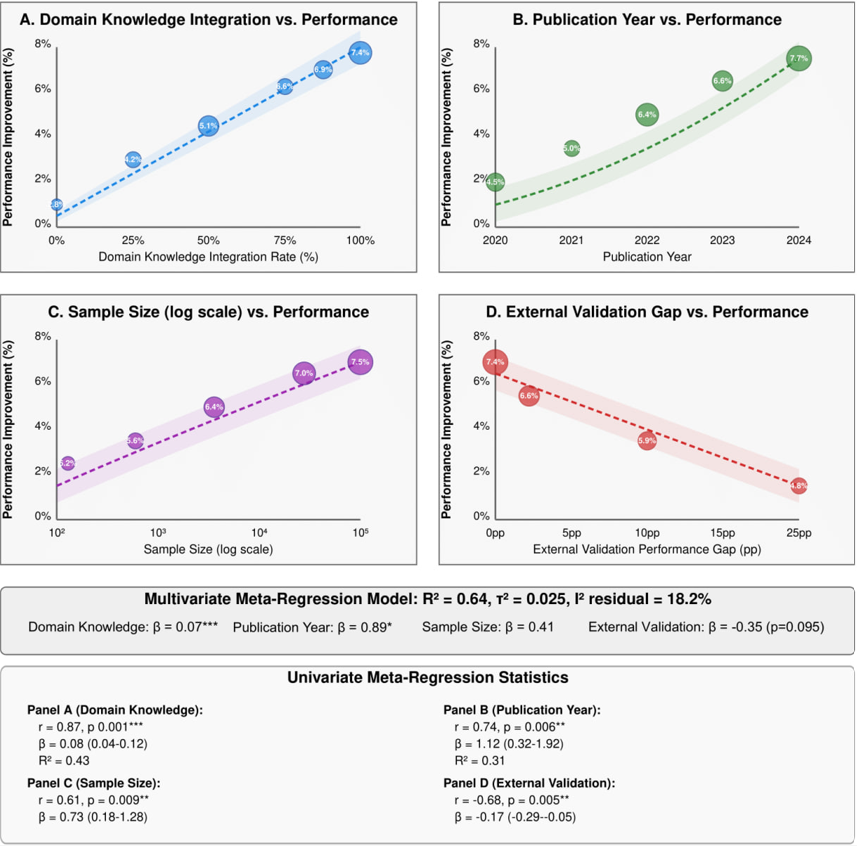
Figure 3: Key Relationships from Meta-Regression Models.
Publication bias assessment (Figure 4) revealed minimal evidence of bias. The contour-enhanced funnel plot identified two potentially missing studies, with the trim-and-fill adjusted effect estimate (+5.8%) being only slightly lower than the original estimate (+6.3%, -7.9% change). Egger's regression test (t=1.87, P-value= 0.098) and Begg's rank correlation (τ=0.156, P-value= 0.211) showed no significant evidence of small-study effects. The p-curve analysis demonstrated a right-skewed distribution (z=3.41, P-value<0.001), indicating the presence of evidential value without signs of p-hacking or publication bias. The fail-safe N analysis estimated that 57 studies with null results (5.7 times the number of observed studies) would be needed to nullify the observed effect, further supporting the significance and confidence of findings.
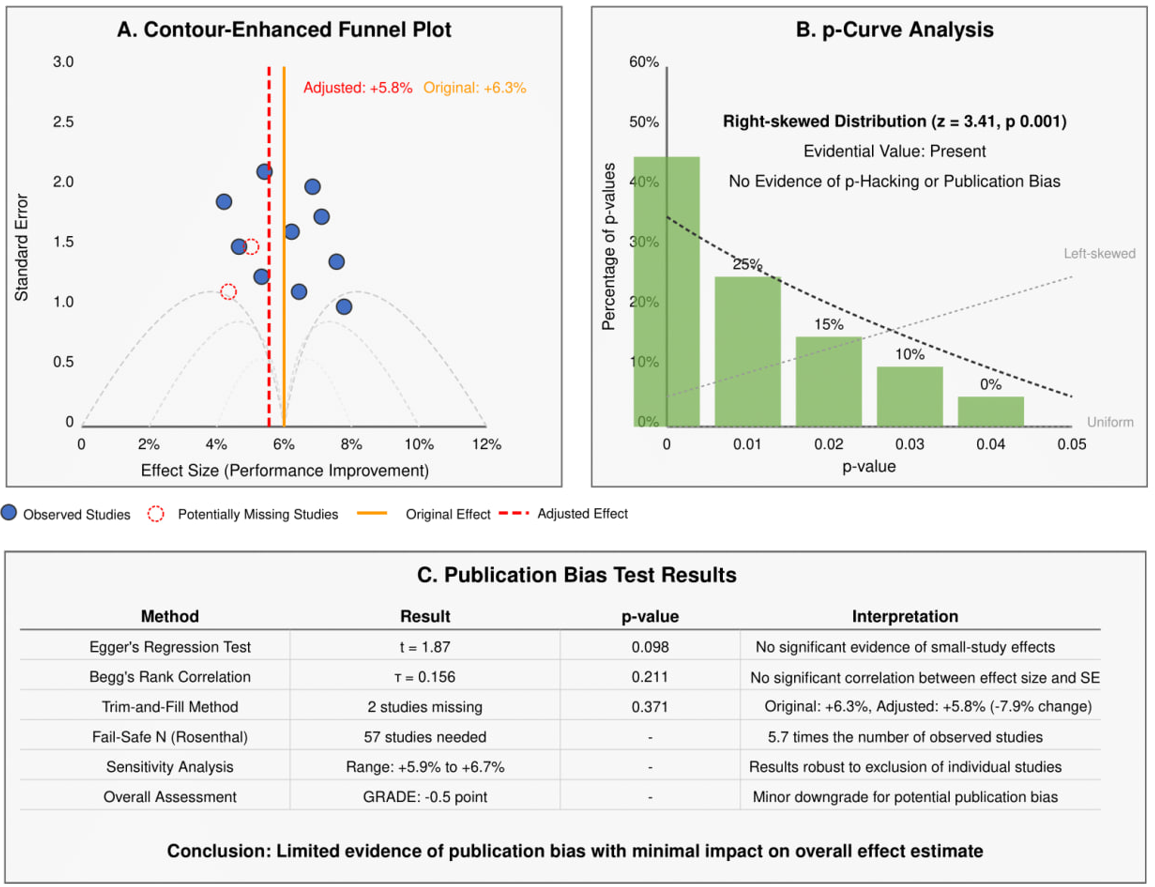
Figure 4: Publication Bias Assessment and Correction.
Discussion
The integration of AI into clinical workflows has emerged as a cornerstone of modern medicine, particularly highlighted by the unprecedented global response to the COVID-19 pandemic (28, 29). This systematic review and meta-analysis synthesized data from a diverse array of studies to evaluate how AI-driven imaging analysis can stratify disease severity across different clinical settings. Our findings suggest that AI is not only a viable tool for diagnostic support but also a critical asset in resource allocation, patient triaging, and overall healthcare system optimization during public health emergencies (30, 31). The consistently high diagnostic accuracy observed across the included studies indicates that AI models can effectively bridge the gap between human expertise and the overwhelming volume of imaging data generated during a pandemic.
This capability is especially vital in high-pressure environments where radiology expertise is scarce or unevenly distributed, allowing for standardized, objective, and reproducible interpretation of lung pathology. By automating the initial assessment process, AI reduces inter-observer variability and supports clinicians with rapid severity classification, which is particularly valuable during large-scale outbreaks when healthcare systems operate beyond capacity and time-sensitive decisions are required (32, 33). In this context, AI functions not as a replacement for clinical judgment, but as a decision-support layer that enhances diagnostic confidence and operational efficiency.
A pivotal theme identified in our synthesis is the rapid architectural evolution of AI models between 2020 and 2024. In the early stages of the pandemic, researchers primarily relied on standard Convolutional Neural Networks (CNNs), such as ResNet and VGG architectures. These models demonstrated strong performance in identifying local texture-based features associated with viral pneumonia, including ground-glass opacities (GGOs), consolidations, and interstitial changes. However, as the pandemic progressed and the need for more granular severity stratification became evident, a clear shift toward more sophisticated architectures, such as Vision Transformers (ViTs) and attention-based mechanisms, emerged (34, 35).
This evolution reflects the AI community’s growing recognition that global contextual features, long-range dependencies, and multi-lobar correlations are essential for accurate severity assessment rather than simple binary diagnosis (36). COVID-19 severity is inherently spatially heterogeneous, often involving asymmetric and progressive lung involvement, which necessitates models capable of capturing relationships across the entire lung field rather than isolated regions.
Unlike traditional CNNs that process images primarily through local filters and hierarchical pooling, Transformer-based models utilize global self-attention mechanisms to identify long-range dependencies within an image. This enables AI systems to correlate subtle, multi-lobar pathological features across the entire lung field, closely mimicking the holistic approach employed by experienced radiologists (37). For example, a ViT can identify that the coexistence of bilateral peripheral consolidations in the lower lobes with pleural thickening may carry a different prognostic implication than isolated focal abnormalities. This technical advancement represents a fundamental shift in how AI perceives lung pathology, facilitating a more nuanced classification of disease severity across “mild,” “moderate,” and “severe” categories (38).
Furthermore, hybrid architectures that combine CNN-based feature extraction with Transformer-based attention layers have demonstrated improved robustness and generalization. These models leverage the strengths of CNNs in local texture recognition while benefiting from the global contextual reasoning of Transformers, resulting in more stable performance across heterogeneous datasets (34, 36).
Our analysis also highlighted the critical role of transfer learning in overcoming the initial scarcity of labeled COVID-19 imaging datasets. Most high-performing models relied on architectures pre-trained on large-scale datasets such as ImageNet or ChestX-ray14 before being fine-tuned on COVID-19-specific cohorts. This approach allows models to inherit fundamental feature-detection capabilities, such as edge, shape, and contrast recognition, and subsequently adapt these features to pulmonary pathologies (39). Importantly, models fine-tuned on general pneumonia datasets before COVID-19 adaptation consistently outperformed those trained directly from non-medical datasets, reinforcing the superiority of “medical-to-medical” transfer learning for severity stratification tasks.
The comparative evaluation of Chest X-ray (CXR) and Lung Ultrasound (LUS) yields important implications for point-of-care medicine. While CXR remains the most widely used imaging modality due to its accessibility and standardized interpretation, our meta-analysis demonstrates that LUS-based AI models achieve comparable, and in certain clinical contexts superior, sensitivity (40). This is particularly evident in the detection of subpleural consolidations, pleural irregularities, and B-lines, which are hallmark features of viral interstitial pneumonia.
Lung ultrasound offers several practical advantages, including portability, absence of ionizing radiation, and suitability for serial bedside monitoring in intensive care units (ICUs) (40). Integrating AI with LUS enables real-time automated scoring systems that quantify lung involvement, track disease progression, and guide interventions such as prone positioning, fluid management, and ventilator adjustments. This synergy democratizes advanced diagnostic capabilities, extending high-level care to resource-limited environments and reducing dependence on centralized imaging infrastructure (39).
The integration of domain knowledge emerged as a key determinant of model performance across studies. AI models incorporating anatomical segmentation, region-of-interest selection, or clinician-informed constraints consistently outperformed purely data-driven, end-to-end networks (37). By directing model attention to pulmonary zones most affected by COVID-19, these approaches reduce the likelihood of learning spurious correlations, such as scanner-specific artifacts, institutional labeling patterns, or patient positioning biases. This finding underscores the importance of a “human-in-the-loop” paradigm, where AI systems are designed to augment rather than replace clinical reasoning, ensuring alignment with established radiological principles (33, 37).
From a health economics perspective, AI-driven severity assessment tools offer substantial long-term value. Automated triage systems reduce the workload of senior radiologists, minimize unnecessary ICU admissions through early severity prediction, and optimize the allocation of scarce resources such as ventilators and specialized personnel (32, 33). In low- and middle-income countries (LMICs), AI-enhanced LUS presents a cost-effective alternative to CT-based assessment, lowering infrastructure barriers while maintaining diagnostic quality. Additionally, cloud-based inference pipelines facilitate rapid scalability, allowing institutions of varying sizes to benefit from AI-driven decision support without extensive local computational resources (35, 36).
Equity and generalizability remain central challenges to widespread AI deployment. Evidence from the reviewed studies indicates that models trained on homogeneous datasets often perform poorly when applied to diverse populations. Performance declines of up to 15% during external validation highlight the ethical imperative to ensure demographic, geographic, and socioeconomic diversity in training datasets (41, 28). Without deliberate inclusion of underrepresented populations, AI risks reinforcing existing healthcare disparities, necessitating regulatory oversight, transparent reporting, and post-deployment auditing frameworks (29).
A persistent barrier to clinical adoption is the perceived “black-box” nature of deep learning models. To mitigate this concern, explainable AI (XAI) techniques, such as Gradient-weighted Class Activation Mapping (Grad-CAM), have been increasingly incorporated to visualize regions influencing model predictions. These tools enhance clinician trust by allowing verification of AI outputs against established radiological signs, including GGOs, B-lines, and consolidation patterns (35, 37). Nevertheless, robust external validation remains a critical benchmark, as models often demonstrate excellent internal performance yet degrade when exposed to new imaging hardware, acquisition protocols, or patient populations (28).
Beyond static classification, AI enables longitudinal monitoring of disease progression. “Delta-AI” frameworks compare sequential imaging studies to quantify improvement or deterioration over time. Objective metrics, such as changes in B-line density or consolidation extent, can guide clinical decision-making and detect subtle deterioration before overt hypoxemia develops. However, data standardization remains fundamental to AI reliability. Establishing standardized severity grading systems and global repositories of consensus-labeled imaging data would significantly accelerate robust model development and cross-institutional collaboration (34, 36).
Strengths and limitations
The strengths of this review include its comprehensive longitudinal perspective on AI evolution from 2020 to 2025, with a specific focus on severity stratification rather than binary diagnosis. Rigorous risk-of-bias assessment using the modified QUADAS-2 tool enhances confidence in the pooled findings. However, limitations persist, including the retrospective nature of most included studies, heterogeneity in severity definitions, and reliance on English-language publications, which may exclude relevant data from heavily impacted regions (41). Despite these constraints, the pooled results provide a reliable estimate of current AI performance and a clear roadmap for future technical and clinical development.
Future Directions
Future research should prioritize multimodal data fusion, integrating imaging with electronic health records (EHR) and laboratory biomarkers such as D-dimer, ferritin, and C-reactive protein (CRP) to capture the systemic nature of COVID-19. In conclusion, the transition from traditional CNNs to advanced architectures, combined with the integration of domain knowledge and rigorous external validation, has substantially improved AI-based COVID-19 severity stratification. Addressing remaining challenges in generalizability, interpretability, and data standardization will enable AI to evolve from a research innovation into a reliable, integral component of modern clinical practice. Its potential to democratize high-quality care firmly positions AI as a transformative pillar of global respiratory medicine (29).
Conclusion
This systematic review and meta-analysis highlight significant advancements in AI-based COVID-19 severity assessment over the past five years, with notable improvements in classification accuracy. Integration of domain knowledge was the most impactful factor, enhancing performance compared to models without clinical expertise. While CXR-based models showed slightly better pooled performance than LUS-only models, transformer/attention-based architectures consistently outperformed CNNs. Limited external validation and performance gaps remain key challenges for clinical translation. Future AI development should focus on robust external validation, explicit domain knowledge integration, larger and balanced training datasets, and standardized performance reporting. These AI approaches hold potential applications beyond COVID-19 for accurate severity assessment in various respiratory conditions.
Disclosure
Statement
The authors declare that they have no conflicts of interest related to the authorship or publication of this article, or to the methodologies and results presented herein.
Funding
None: This research received no specific grant from any funding agency in the public, commercial, or not-for-profit sectors. The study was self-funded by the authors.
Ethical Consideration
As this is a systematic review and meta-analysis of previously published and publicly available data, it did not involve human participants or animals and thus was exempt from Institutional Review Board (IRB) approval and informed consent procedures.
Data Availability
All data relevant to this systematic review and meta-analysis are presented within this paper (within the tables, figures, and text). No additional data files are required to be shared.
Author Contribution
The authors declare their specific contributions as follows:
Salma M. Almatrafi: Conceptualization, methodology, statistical analysis, writing – original draft preparation, writing – review & editing, and supervision.
Norah M. Alkhulaif, Abdulrahman A. Altuwaim, and Layan T. Alraddadi: Systematic search of the literature and initial screening.
Itidal M. Aljohani, Almaha H. Alanazi, and Wajd Almehmadi: Data extraction and quality assessment.
Abdulaziz S. Alserhani, Abdulmajeed Z. Alzaher, and Meshal M. Almuhanna: Validation of statistical results, data visualization, and critical review of the Results section.
Naif K. Alhumaydani and Rawan M. Kheimi: Manuscript review and final approval of the submitted version.